
In short
Implied correlation is the market’s view of how two currencies will move together from here. It can be read from prices that exist every day and can react earlier than a historical data window, for example ahead of elections or central-bank decisions. It is a market price, not a forecast. That is why it complements historical correlation rather than replacing it.
The post
Your correlation matrix looks back. The market looks ahead.
Historical correlation shows how currencies have moved. But it only reacts once a 90-day window has visibly shifted.
Implied correlation is the market’s view of the future. It sits in prices that exist every day and can react earlier, for example ahead of elections or central-bank decisions. You do not need a forecast of your own for it.
But it is a market price, not a prediction. So it does not replace historical correlation, it complements it.
That is why GLORIAnalytics shows both side by side, every day. What to do when they diverge is the subject of the next part.
Does your risk model only look back, or ahead as well?
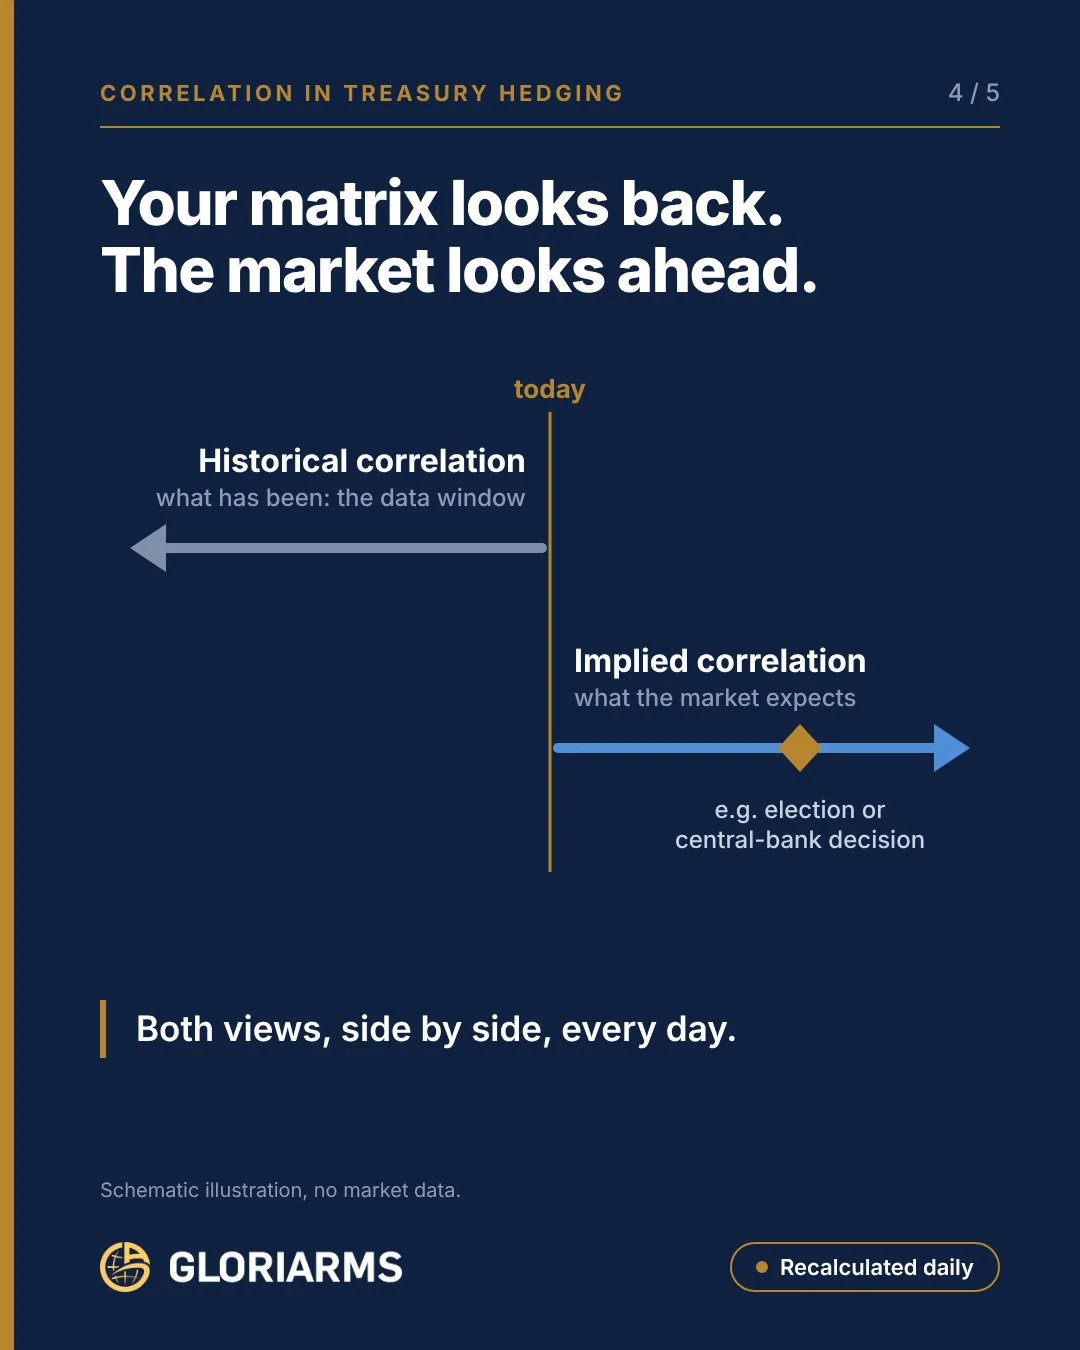
Image content as text
- Your matrix looks back. The market looks ahead.
- Historical correlation: what happened, the data window (left of “today”).
- Implied correlation: what the market expects (right of “today”), e.g. ahead of an election or a central-bank decision.
- Both views, side by side, every day.
- Schematic, not market data.
Where implied correlation comes from
We left the calculation out of the post. Here it is, for anyone who wants the detail. The three pairs of a currency triangle are linked: GBP/USD equals EUR/USD divided by EUR/GBP. Their volatilities are therefore linked as well, and three volatilities traded in the option market reveal the correlation the market is pricing.
| Currency pair | Implied volatility (ATM) |
|---|---|
| EUR/USD | 7.5% |
| EUR/GBP | 6.0% |
| GBP/USD | 8.6% |
| Implied correlation USD/GBP against EUR | ρ = (7.5² + 6.0² − 8.6²) / (2 × 7.5 × 6.0) ≈ 0.20 |
Two caveats belong with it. First, implied correlation is a market price, not an unbiased forecast: part of it can simply be a risk premium. Second, a single number suggests more precision than it has. Just ±0.2 volatility points per quote turn 0.20 into anything between about 0.11 and 0.28.
That is exactly why both views belong side by side. Historical correlation shows what happened, implied correlation what the market prices now. It gets interesting when the two diverge, which is what part 5 is about.
First published on October 26, 2026 on LinkedIn. Original language: German. Join the discussion on LinkedIn → Website version: adapted from the original with AI assistance · reviewed by S. Hamberger

Stefan Hamberger
More than 30 years in FX and eFX, previously Managing Director at Commerzbank and Crédit Agricole CIB. Helps CFOs and treasurers understand their FX risk before the market moves.
LinkedIn →