
In short
If implied correlation sits above historical correlation, the market prices more co-movement. That is not proof of a break, but a reason to look. If both are close, there is currently no notable difference. If implied sits below, that can raise risk too, for example when natural hedges lose their effect. A traffic light that flags unusual gaps does not predict anything; it tells you when to review your assumptions.
The post
The most interesting number in a correlation panel is the gap. Between what happened and what the market is pricing now.
- Market above: it prices a rise in correlation. Not proof of a break, but a reason to look.
- Both close together: your assumption holds.
- Market below: it prices a fall in correlation. That can raise your risk too, for example when natural hedges lose their effect.
In GLORIAnalytics both sit side by side every day, together with a traffic light that flags when the gap is unusual compared with its own last 250 days.
The traffic light does not forecast anything. It tells you when to review your assumptions.
Would you like to see this on your own portfolio? I am happy to show you on an anonymised version.
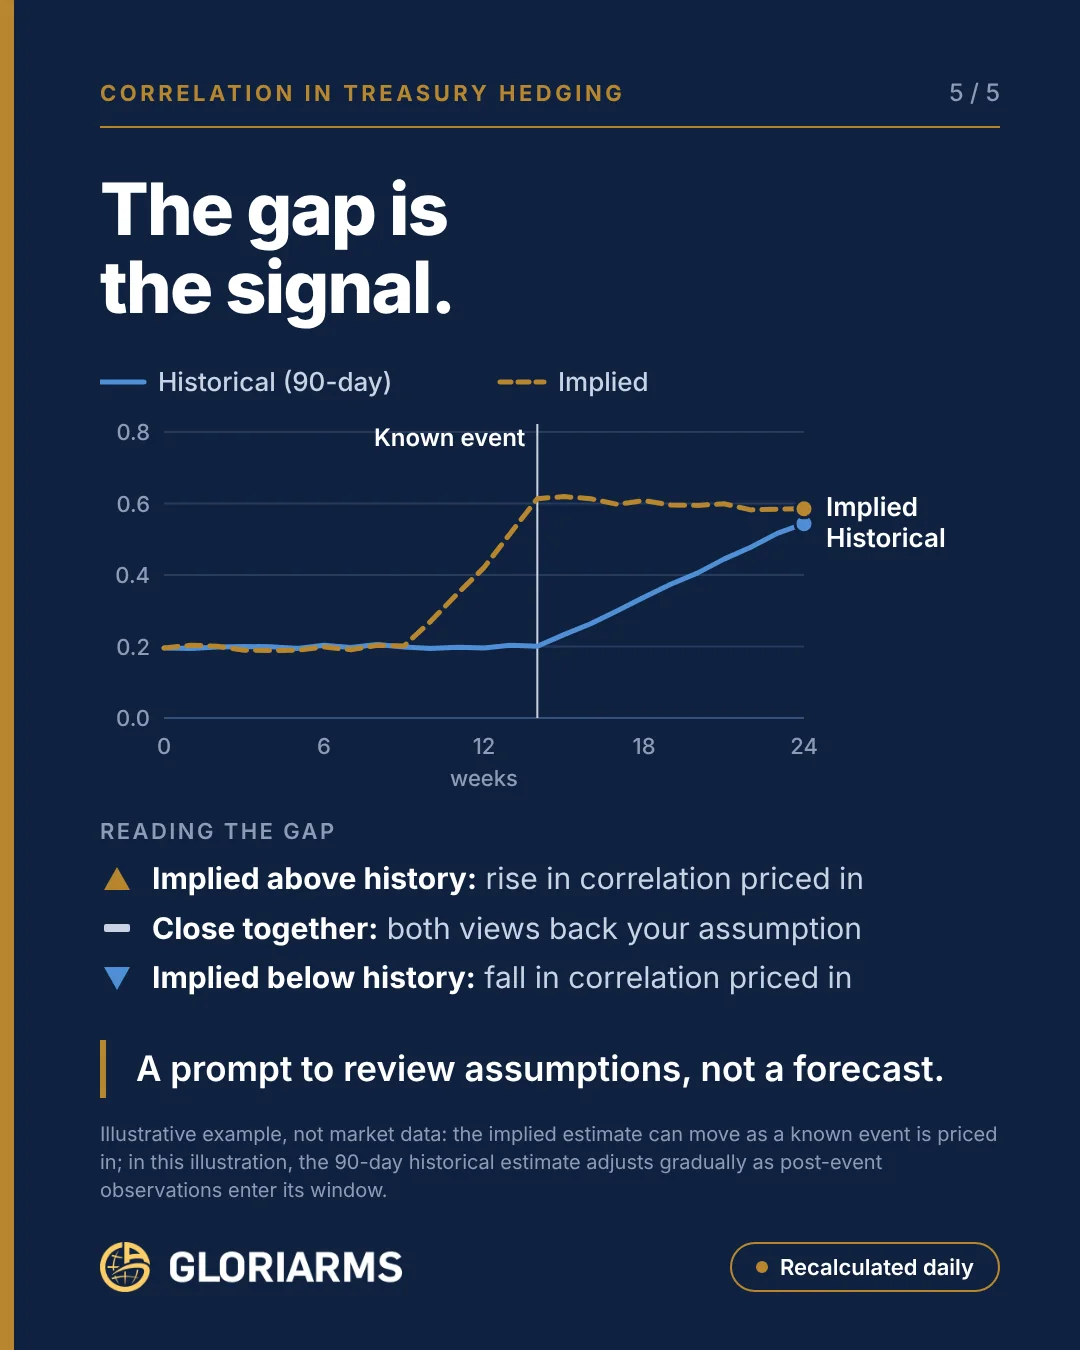
Image content as text
- The gap is the signal.
- Line chart over 24 weeks: historical (90 days) and implied. Ahead of a known event in week 14, implied correlation rises from about 0.2 to about 0.6; historical correlation stays near 0.2 at first and then rises gradually.
- Reading the gap: implied above, a rise in correlation is priced. Close together, both views back the assumption. Implied below, a fall in correlation is priced.
- A prompt to review, not a forecast.
- Illustrative example, not market data.
Why both directions matter
The image for this article shows a typical pattern. Ahead of a known event, an election or a central-bank decision for instance, implied correlation rises markedly while the historical 90-day correlation initially stays flat. Only after the event do the new observations gradually enter the data window, and historical correlation slowly catches up.
Whether higher or lower correlation raises risk depends on the portfolio. With two receivables in currencies that start moving more closely together, risk goes up. With a receivable and a payable that used to offset each other, it is the other way round: if correlation falls, that natural hedge loses its effect. So the gap on its own is not an instruction. Only the view of your own portfolio shows what it means.
The traffic light compares today’s gap with its own history over the last 250 trading days. It flags a gap that is unusually large, not one that simply exists. That is deliberate: in normal times part of the gap is risk premium. How to turn this into hedging decisions is covered on the correlation-driven hedging topic page.
First published on October 29, 2026 on LinkedIn. Original language: German. Join the discussion on LinkedIn → Website version: adapted from the original with AI assistance · reviewed by S. Hamberger

Stefan Hamberger
More than 30 years in FX and eFX, previously Managing Director at Commerzbank and Crédit Agricole CIB. Helps CFOs and treasurers understand their FX risk before the market moves.
LinkedIn →