
In short
Correlations are not constants of nature but a market state. In stress phases they can shift quickly: currencies that usually move independently suddenly move together, and natural hedges lose their effect. In the example the diversification benefit shrinks from 53% to about 24%. What matters is how quickly you notice the shift.
The post
Diversification is a fair-weather friend.
Same portfolio as in the last post. Calm market: risk 7.0. Stress phase: 11.4. Nothing about the positions changed. Only the correlations:
- USD/GBP: from 0.20 to 0.85
- JPY against USD and GBP: from 0.40 / 0.35 to −0.15 / −0.10. The natural hedge of the JPY payable no longer works.
Of the 53% diversification benefit, about 24% is left.
Correlation is not a constant of nature, it is a market state. It often breaks exactly when it matters: in liquidity shocks, central-bank surprises, risk-off phases.
No model predicts the next break. But you can influence how quickly you notice it. Reviewed monthly, you see a shift only after it has grown. Recalculated daily, you see it while it is still small.
That is why we recalculate correlations in GLORIAnalytics every day, not just at the reporting date.
What if your assumption fails exactly when it matters?
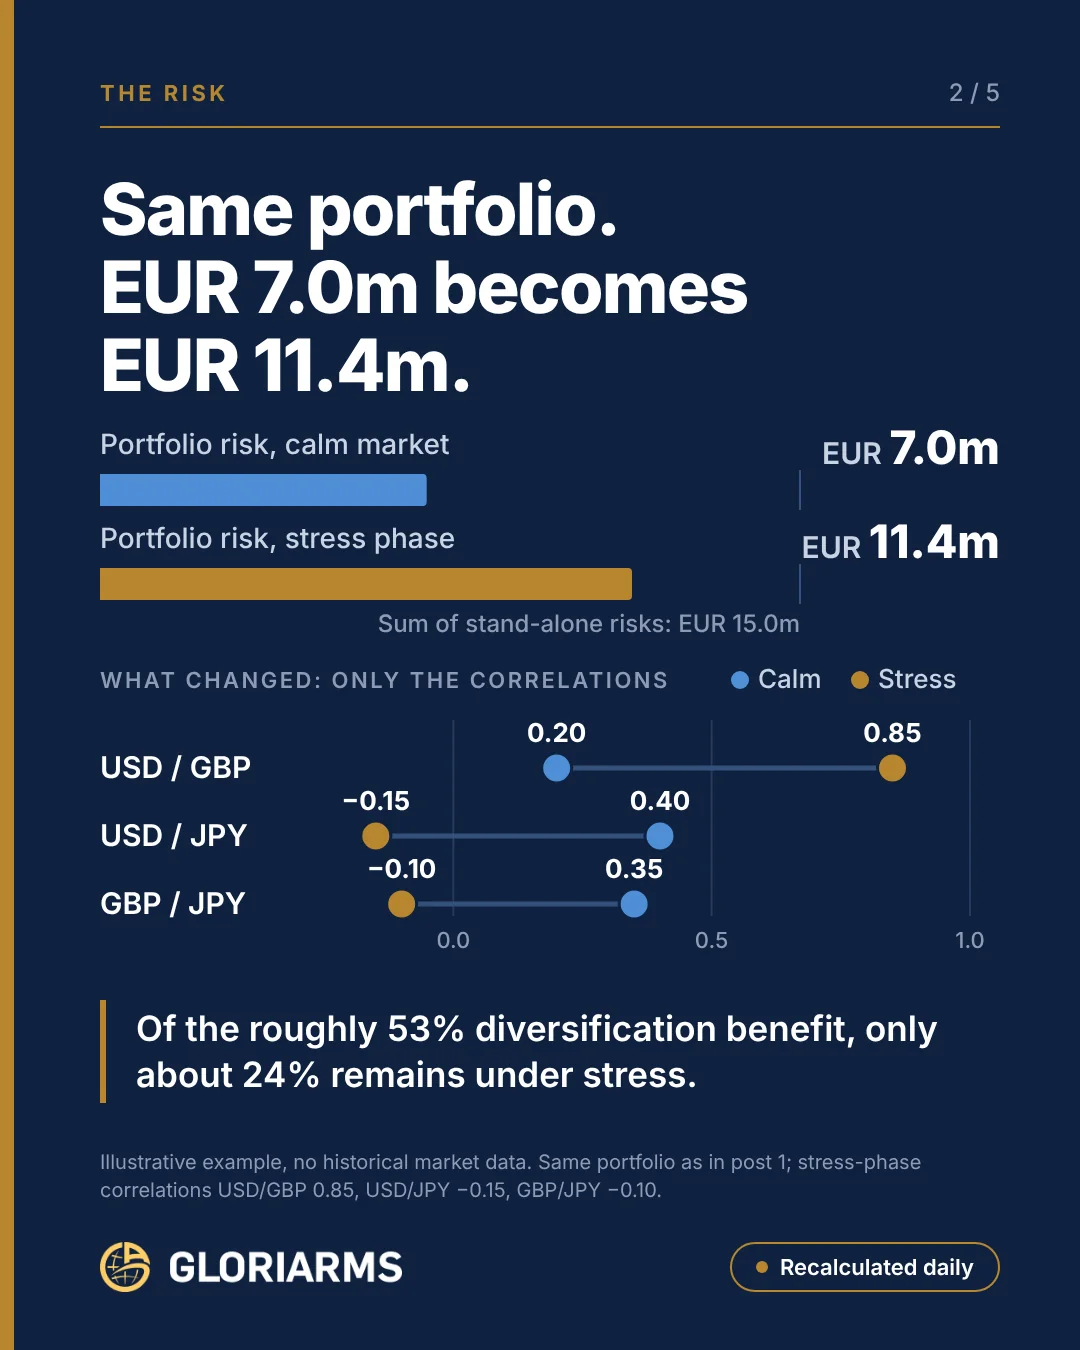
Image content as text
- The risk: same portfolio, EUR 7.0m becomes EUR 11.4m.
- Portfolio risk calm: EUR 7.0m; portfolio risk stress: EUR 11.4m; sum of stand-alone risks: EUR 15.0m.
- What changes, only the correlations (calm → stress): USD/GBP 0.20 → 0.85; USD/JPY 0.40 → −0.15; GBP/JPY 0.35 → −0.10.
- Of the roughly 53% diversification benefit, only about 24% remains under stress.
- Illustrative example, no historical market data.
What changes in the stress phase
| Calm market | Stress phase | |
|---|---|---|
| Correlation USD/GBP | 0.20 | 0.85 |
| Correlation USD/JPY | 0.40 | −0.15 |
| Correlation GBP/JPY | 0.35 | −0.10 |
| Portfolio risk | EUR 7.0m | EUR 11.4m |
| Diversification benefit vs. EUR 15.0m | about 53% | about 24% |
Two things happen at once. The dollar and the pound move more closely together, so the two receivables reinforce each other. And the yen decouples from both: it no longer moves with them but slightly against them. The JPY payable stops offsetting the receivables and now even adds to the risk.
Shifts like this are not a thought experiment. Currencies with a safe-haven reputation in particular behave differently in risk-off phases than in calm markets. A correlation matrix taken from a calm period then shows a diversification benefit that no longer exists.
The conclusion is not to ignore correlation and add everything up. It is to watch it continuously. Part 3 shows what that means for cash flow at risk.
First published on October 14, 2026 on LinkedIn. Original language: German. Join the discussion on LinkedIn → Website version: adapted from the original with AI assistance · reviewed by S. Hamberger

Stefan Hamberger
More than 30 years in FX and eFX, previously Managing Director at Commerzbank and Crédit Agricole CIB. Helps CFOs and treasurers understand their FX risk before the market moves.
LinkedIn →