
In short
Cash flow at risk answers the question of how far planned operating cash flow can fall short. How wide that answer is depends heavily on the correlation matrix. If the matrix is outdated, CFaR shows a diversification benefit that looks plausible on paper and fails under stress. A matrix recalculated every day does not predict a break, but it can show earlier when the assumptions need a second look.
The post
The simulation is not the problem. The stale matrix is.
Cash flow at risk answers the question a board really asks: by how much can planned operating cash flow fall short?
The correlation matrix helps decide how wide that answer is. If it is outdated, CFaR shows a diversification benefit that looks plausible on paper and does not hold under stress.
That is why correlation has its own panel in GLORIAnalytics, recalculated every day:
- Historical correlation across all windows at once: EWMA, 30 days to 3 years, full history
- EUR basis, horizons matched to the tenor
- As the primary input for CFaR
It does not predict the next correlation break. It shows every day when you should review your assumptions.
Is correlation on your agenda, as something to build, to replace an existing solution, or simply to keep current? I am happy to show you what this looks like on an anonymised version of your own FX portfolio.
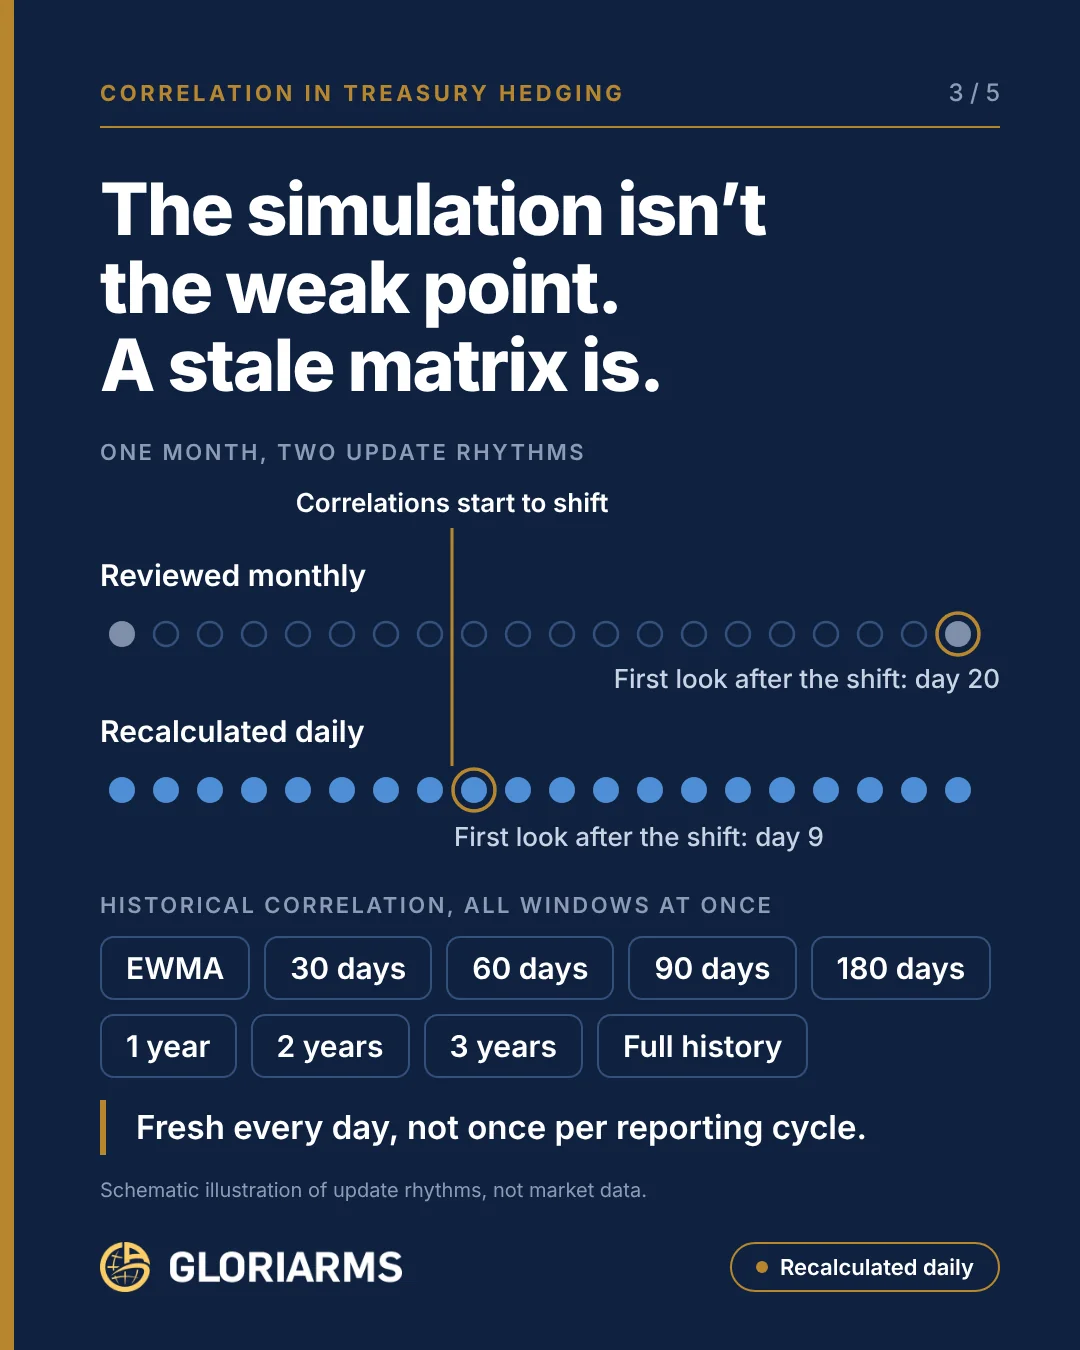
Image content as text
- The simulation is not the problem. The stale matrix is.
- One month, two update rhythms: correlations start to shift on day 8. Reviewed monthly: first look afterwards on day 20. Recalculated daily: first look afterwards on day 9.
- Historical correlation, all windows at once: EWMA, 30 days, 60 days, 90 days, 180 days, 1 year, 2 years, 3 years, full history.
- Fresh every day, not just at the reporting date.
- Schematic, not market data.
Why the rhythm matters
Many companies calculate cash flow at risk monthly or quarterly, using a correlation matrix from a fixed time window. The method behind it, variance-covariance, historical simulation or Monte Carlo, is rarely the problem. The input is. A matrix taken from a calm quarter describes a market that may already be gone.
The image for this article shows the difference schematically. If correlations start to shift on day 8, a daily rhythm can show it on day 9 at the earliest. A monthly review only sees it on day 20, when the shift may already have grown. This is a schematic example, not a guaranteed reaction time.
One window alone is not enough. Short windows and EWMA react quickly but are noisy. Long windows and the full history are stable but slow. Seeing them side by side tells you whether you are looking at a short-lived outlier or a real regime change. Historical correlation always looks backwards, though. What the market prices for the future is the subject of part 4.
First published on October 20, 2026 on LinkedIn. Original language: German. Join the discussion on LinkedIn → Website version: adapted from the original with AI assistance · reviewed by S. Hamberger

Stefan Hamberger
More than 30 years in FX and eFX, previously Managing Director at Commerzbank and Crédit Agricole CIB. Helps CFOs and treasurers understand their FX risk before the market moves.
LinkedIn →